Paste a table and get a chart in your design system's colours and fonts: a vector chart, a statistical plot, a lit 3-D scene or a cinematic flight for video. Lolly Chart draws one table four ways, starts from 43 templates and exports to 20 formats, from SVG and PowerPoint to MP4.
A chart, in four steps:
- Paste your data Cells from a spreadsheet, or CSV.
- Pick a goal or a template Chart suggests a form, or you choose one.
- Style the chart Palette, style and, for 3-D, camera and finish.
- Export A still, a slide, a print file or a video.
One table, four renderers
The same six months of orders, drawn by each renderer. The table, the titles, the palette and the labels carry over when you switch renderer.
 signed by Lollyvector SVG21 paths~2.0k nodes4 groups30 KBCheck it yourselfAmbil file bertanda tanganTry it in the appVector. 35 chart types drawn as clean SVG, from bars and lines to treemaps, sunbursts, chord diagrams and word clouds.
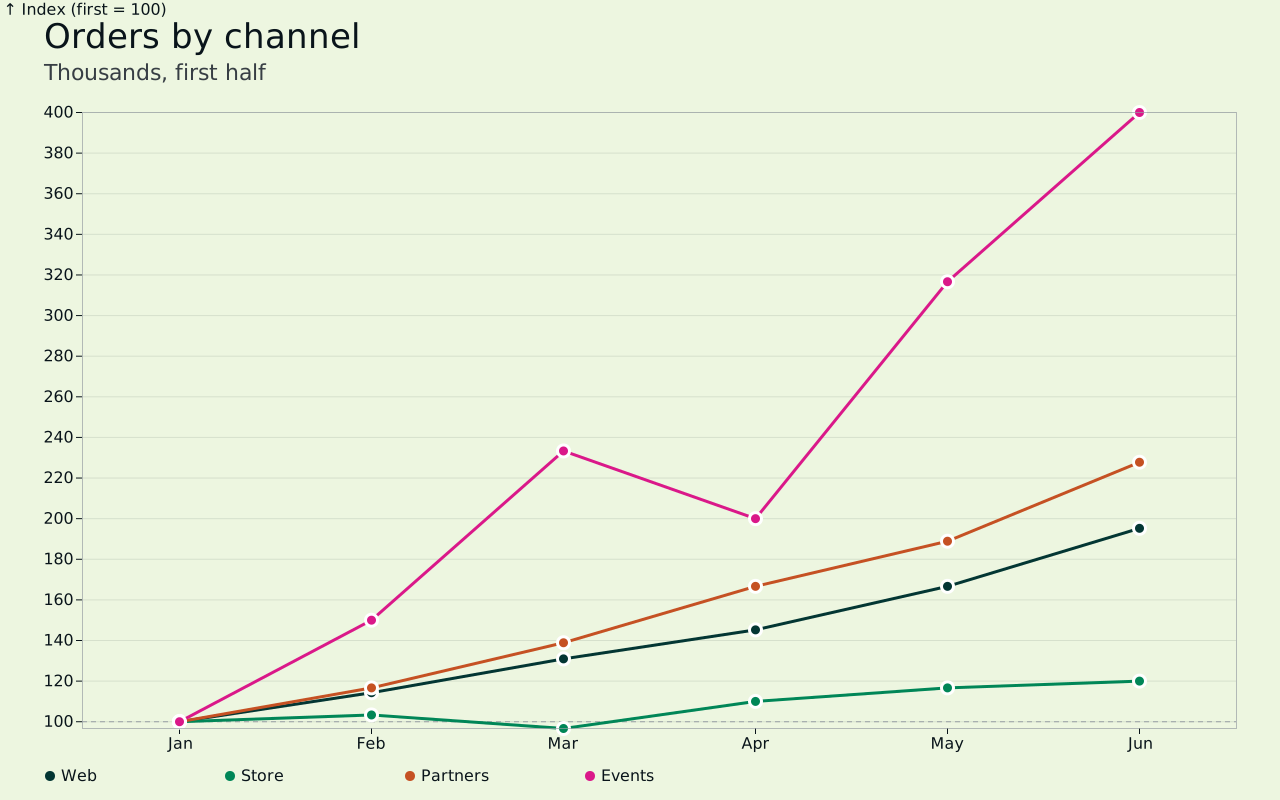 signed by Lollyvector SVG46 paths88 nodes13 groups23 KBCheck it yourselfAmbil file bertanda tanganTry it in the appStats. 16 statistical forms: indexed change, ranges and uncertainty bands, distributions, density, regression and candlesticks.
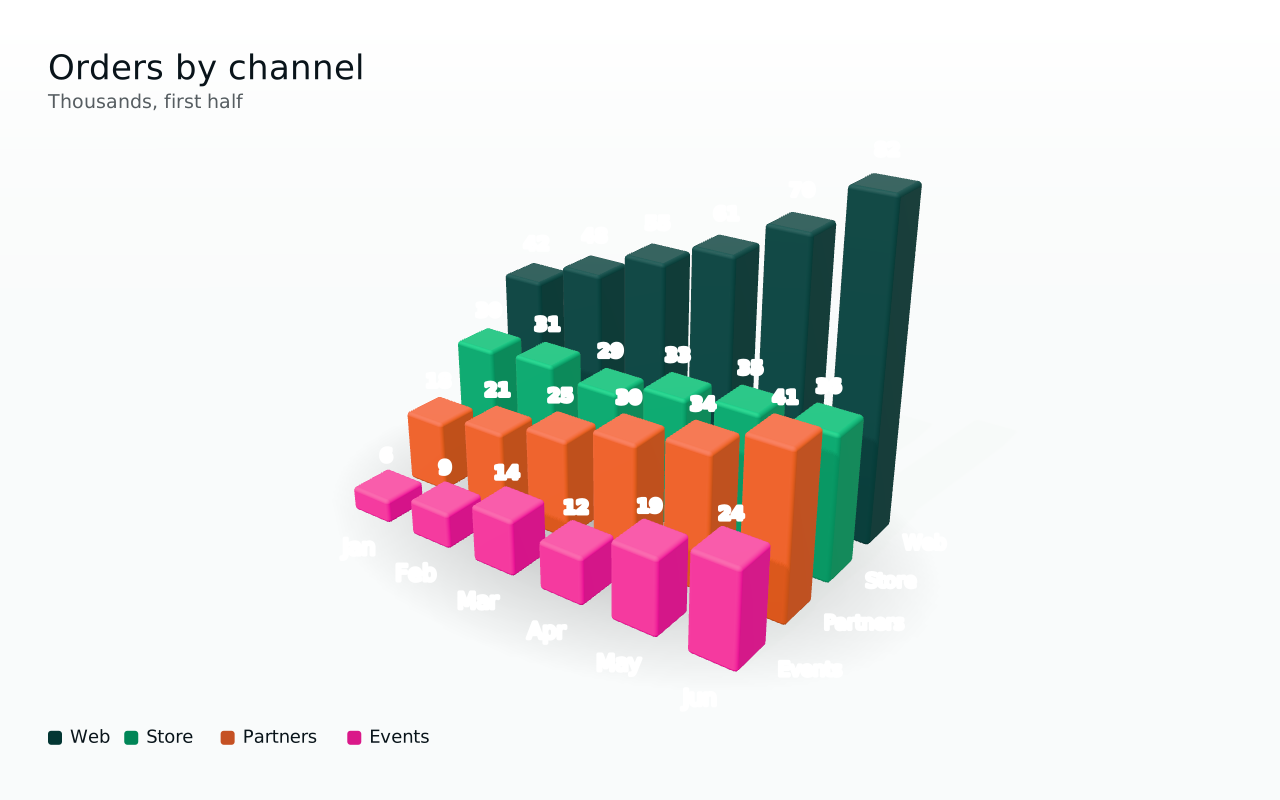 signed by Lollyvector SVGpixels, not shapes208 KBCheck it yourselfAmbil file bertanda tanganTry it in the app3-D. 13 scene types with a real camera, light and materials: bars, walls, tiles, a city of values, spirals, scatter and surfaces.
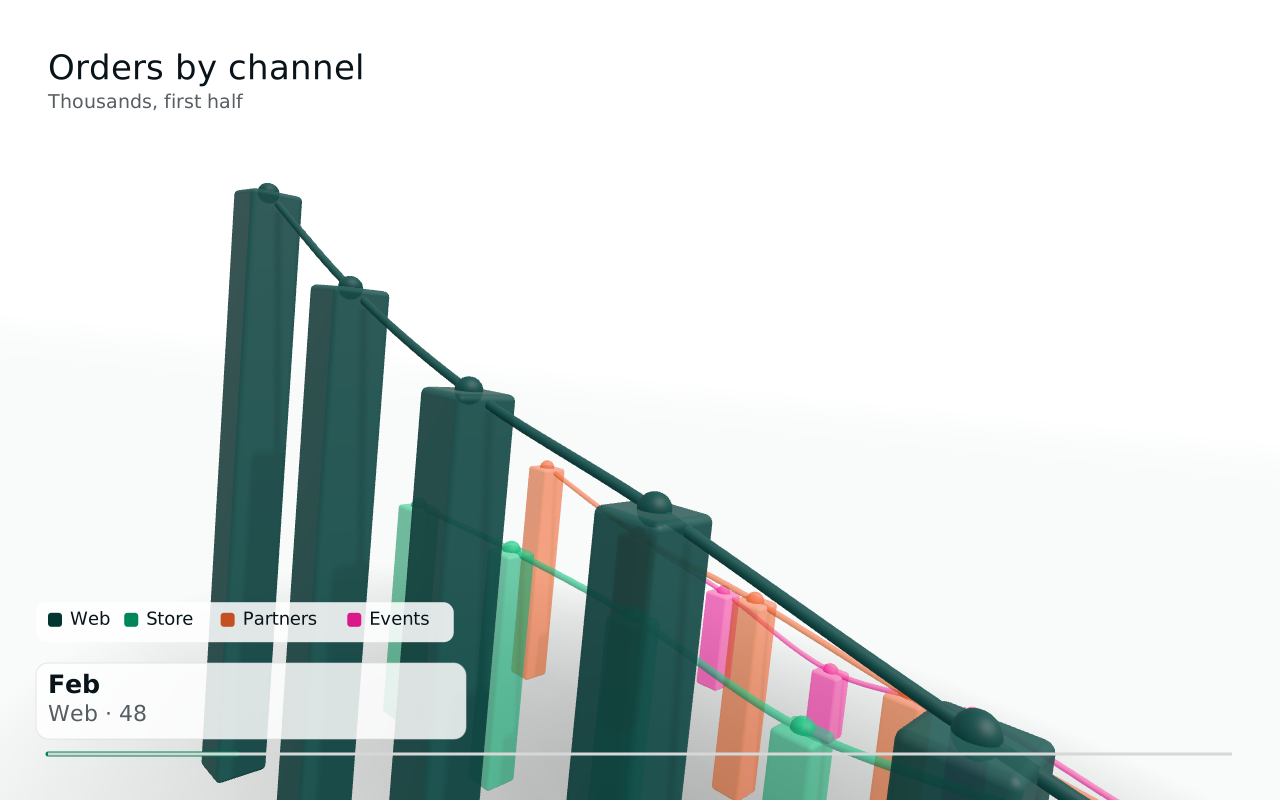 signed by Lollyvector SVGpixels, not shapes380 KBCheck it yourselfAmbil file bertanda tanganTry it in the appCinema. 9 camera flights that tell the story of the data, for video and presentations.


Start from a template
Chart has 43 templates in eleven groups, among them 3-D, Cinematic, Brand, Share, Bars and Lines. Each template fills in a sample table and a finished look from your design system, so switching design system or colourway recolours every template. Replace the sample data with your own and the look stays. Let Chart recommend, under Start here, starts from a goal instead of a form.
 signed by Lollyvector SVG16 paths~2.4k nodes2 groups33 KBCheck it yourselfAmbil file bertanda tanganTry it in the appTreemap. Parts of a whole as tiles sized by value.
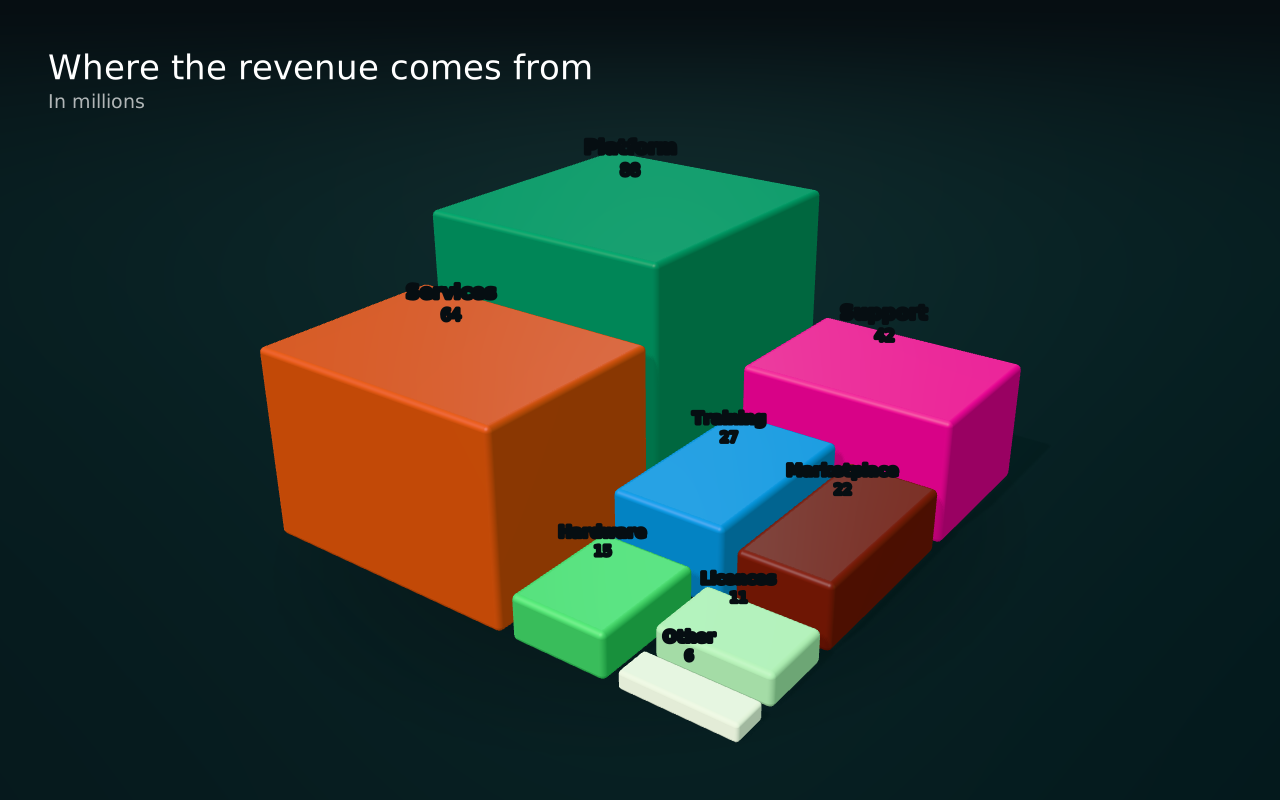 signed by Lollyvector SVGpixels, not shapes308 KBCheck it yourselfAmbil file bertanda tanganTry it in the appA city of values. The treemap's revenue again, raised into buildings in 3-D.
 signed by Lollyvector SVG26 paths~3.0k nodes2 groups39 KBCheck it yourselfAmbil file bertanda tanganTry it in the appSunburst. Two levels in one chart: regions inside, their products outside.
 signed by Lollyvector SVG21 paths~2.9k nodes3 groups39 KBCheck it yourselfAmbil file bertanda tanganTry it in the appMarimekko. Size and share at once: wide columns are the big markets.
 signed by Lollyvector SVG17 paths~2.0k nodes3 groups28 KBCheck it yourselfAmbil file bertanda tanganTry it in the appStream. Several series as layers that flow around a centre line.
 signed by Lollyvector SVG20 paths~3.3k nodes3 groups44 KBCheck it yourselfAmbil file bertanda tanganTry it in the appRadial share. Shares as arcs around a circle.
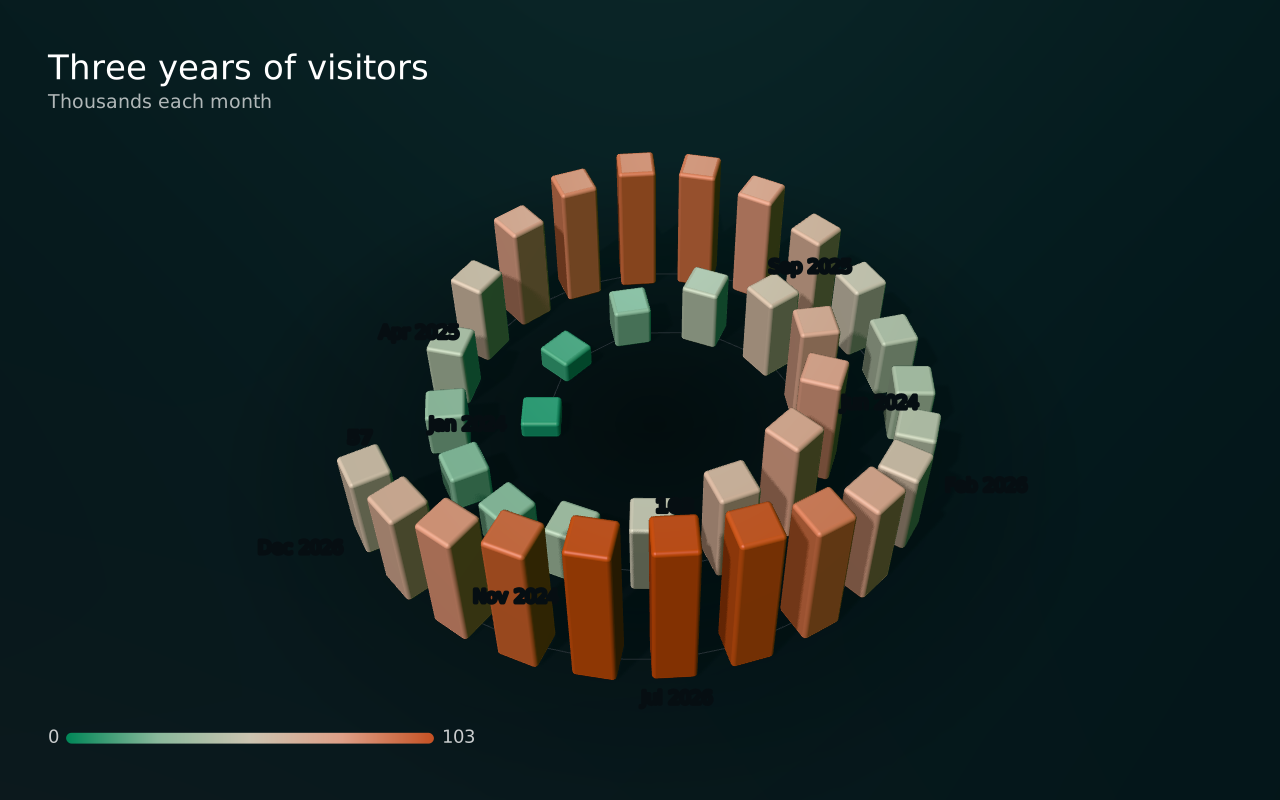 signed by Lollyvector SVGpixels, not shapes381 KBCheck it yourselfAmbil file bertanda tanganTry it in the appA long series, coiled. Three years of months in a 3-D spiral, on a diverging ramp from the low months to the high ones.
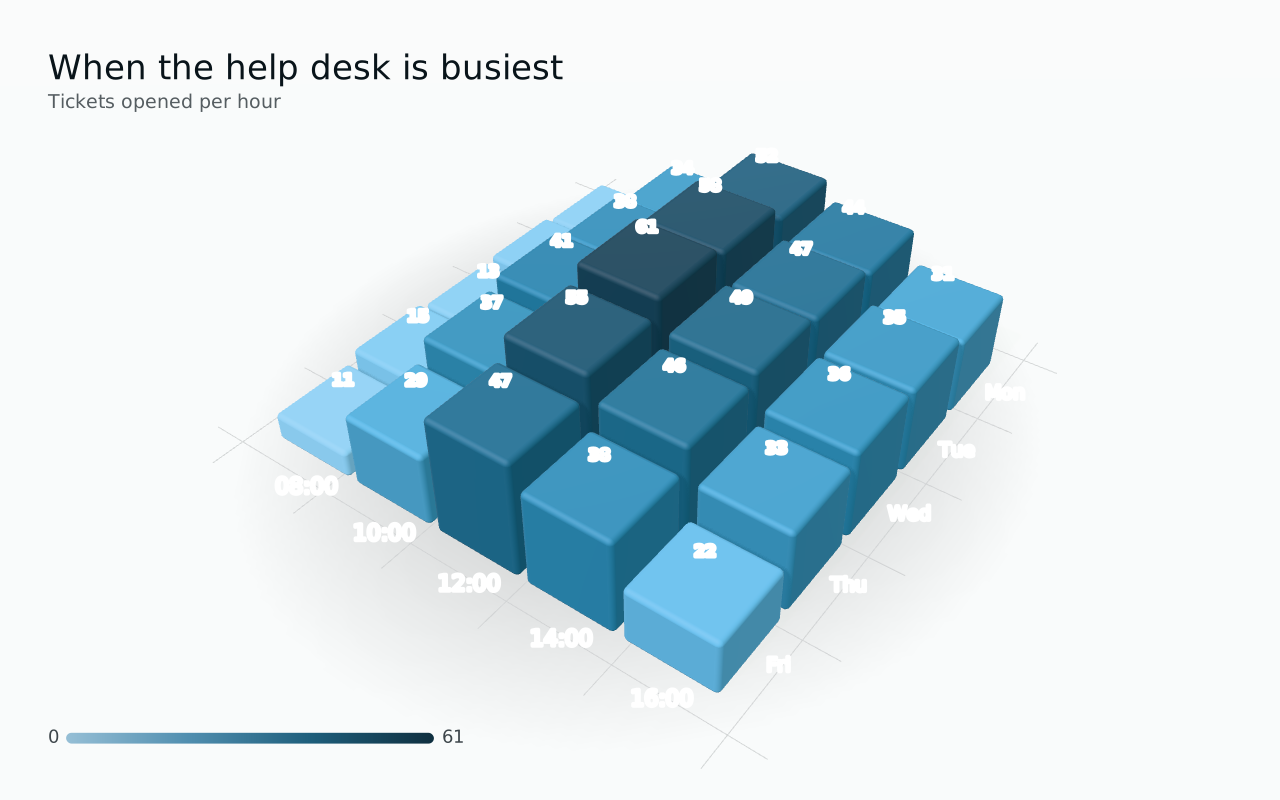 signed by Lollyvector SVGpixels, not shapes325 KBCheck it yourselfAmbil file bertanda tanganTry it in the appA heat map in relief. Each cell becomes a tile whose height and colour both carry the value, so the busy hours rise out of the week.
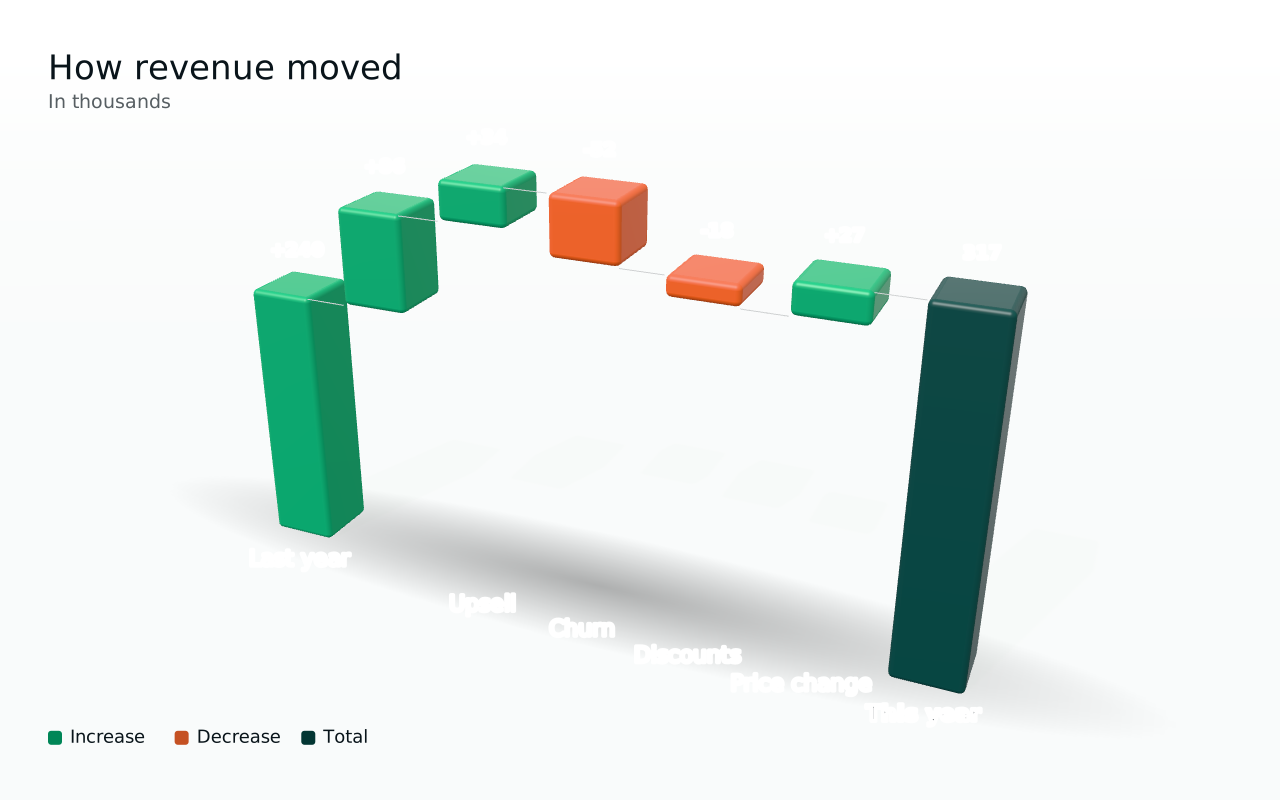 signed by Lollyvector SVGpixels, not shapes211 KBCheck it yourselfAmbil file bertanda tanganTry it in the appFrom last year to this. A 3-D waterfall: each step adds or takes away.
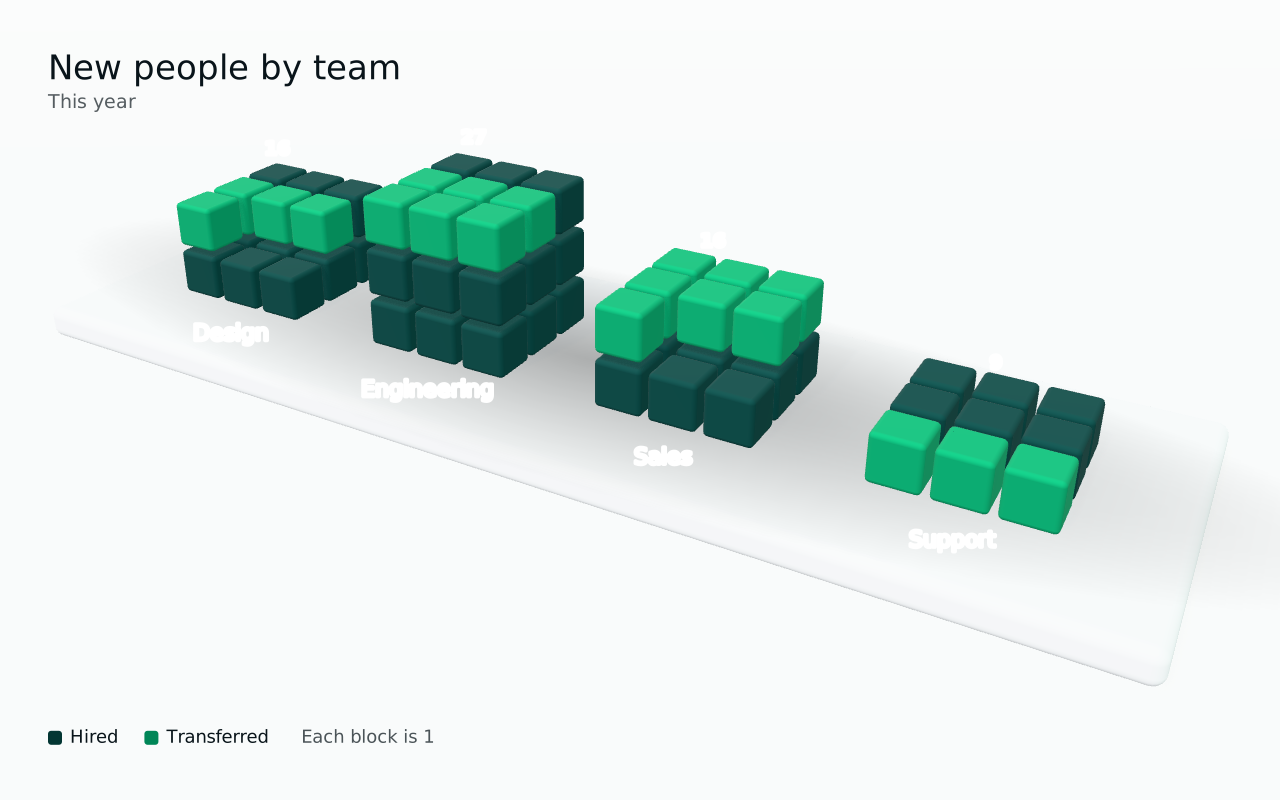 signed by Lollyvector SVGpixels, not shapes385 KBCheck it yourselfAmbil file bertanda tanganTry it in the appCount it in blocks. One block for each unit, for counts people can see.
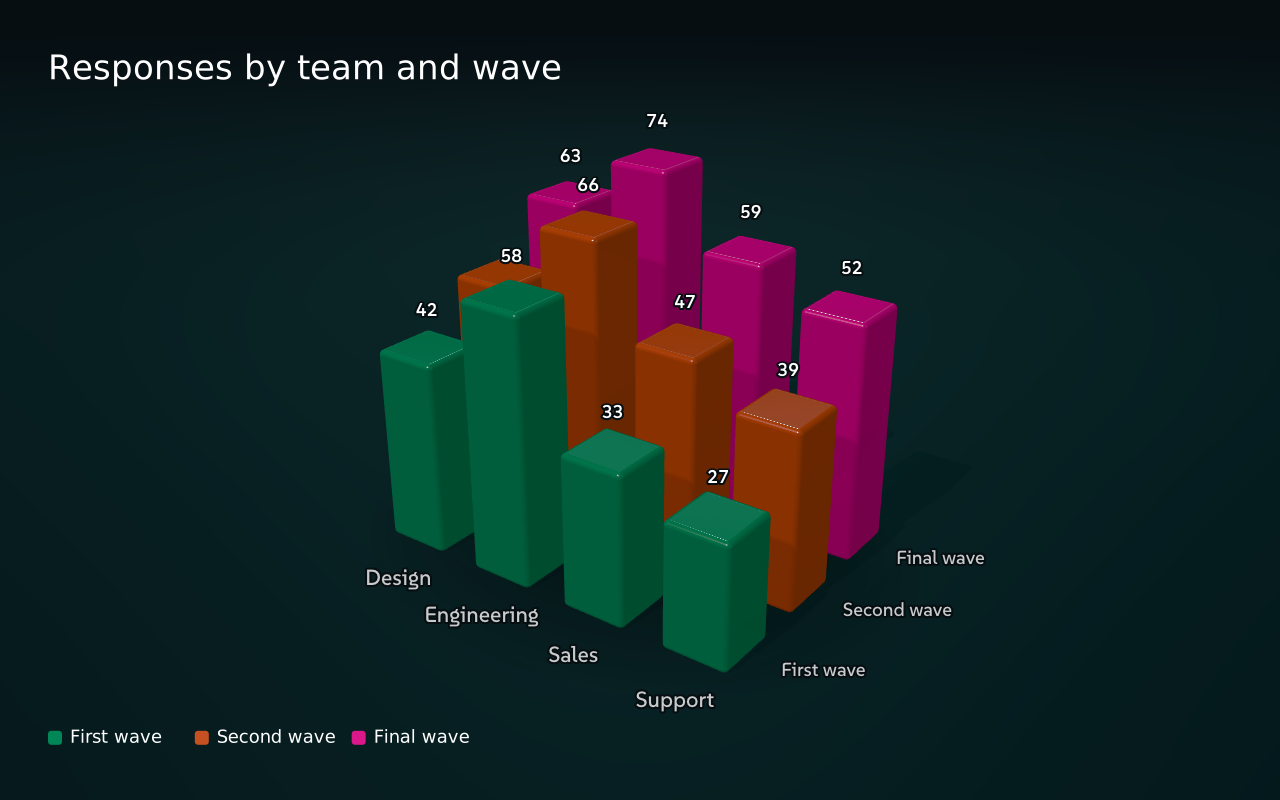 signed by Lollyvector SVGpixels, not shapes286 KBCheck it yourselfAmbil file bertanda tanganTry it in the appGlass 3-D bars. The Glass 3-D style: translucent bars on a night stage built from the design system's deepest colour.
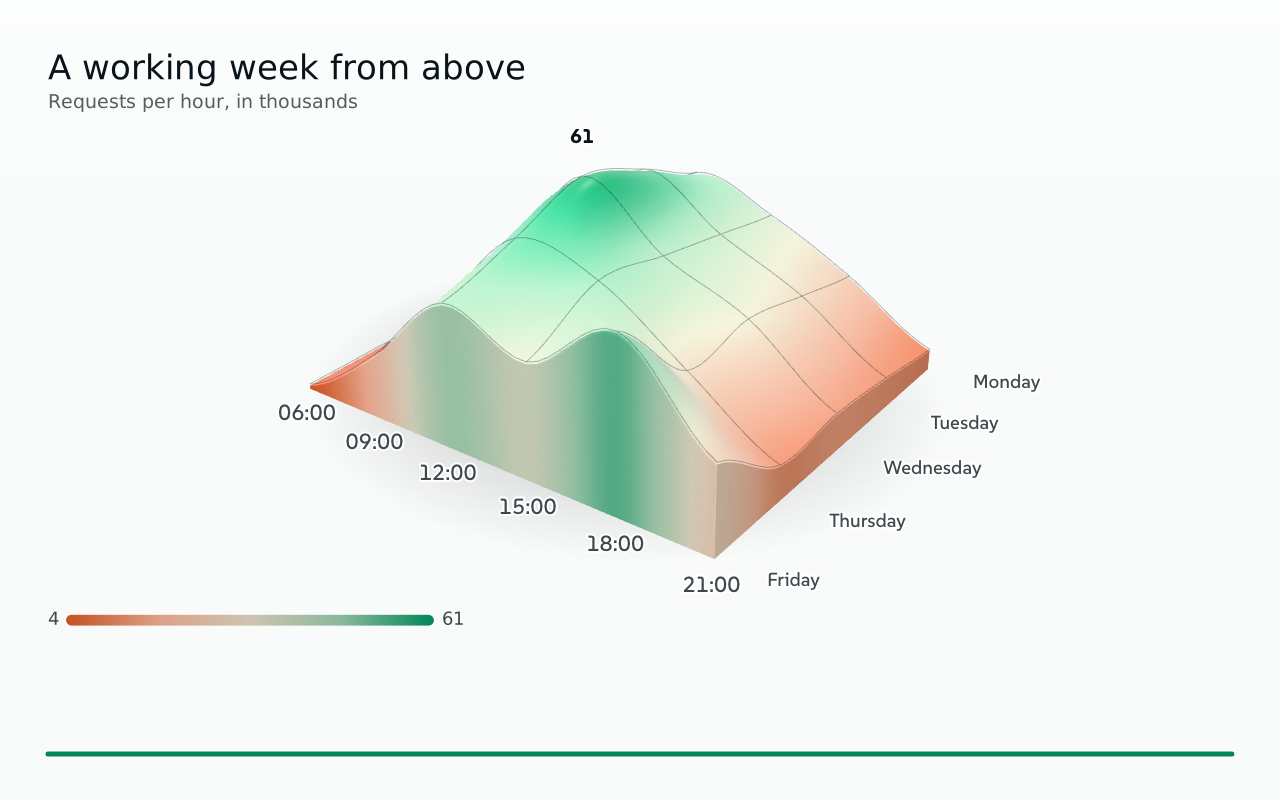 signed by Lollyvector SVGpixels, not shapes360 KBCheck it yourselfAmbil file bertanda tanganTry it in the appFly over the data. A cinematic flight over the peaks and low ground of a grid.


The template chooser opens when you open Chart without a link. To open on one template every time, or on a blank chart, see Start with. You can save a styled chart as your own template, as with any tool (Save one from a tool).
Make a chart
- Open Lolly Chart and choose a template, or Let Chart recommend.
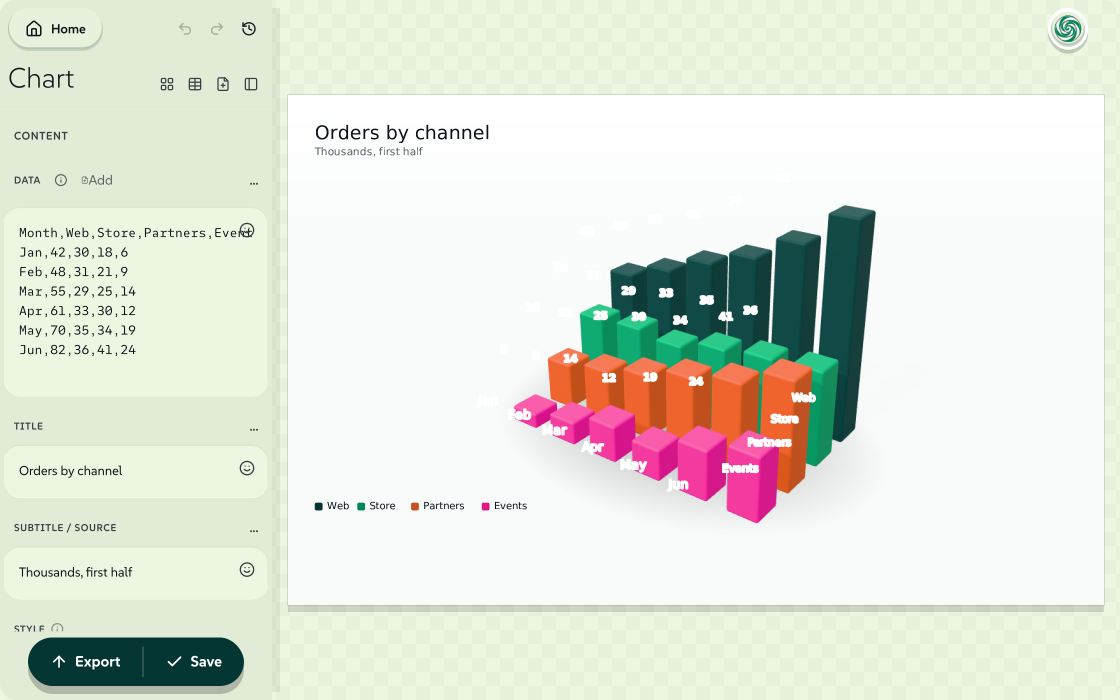
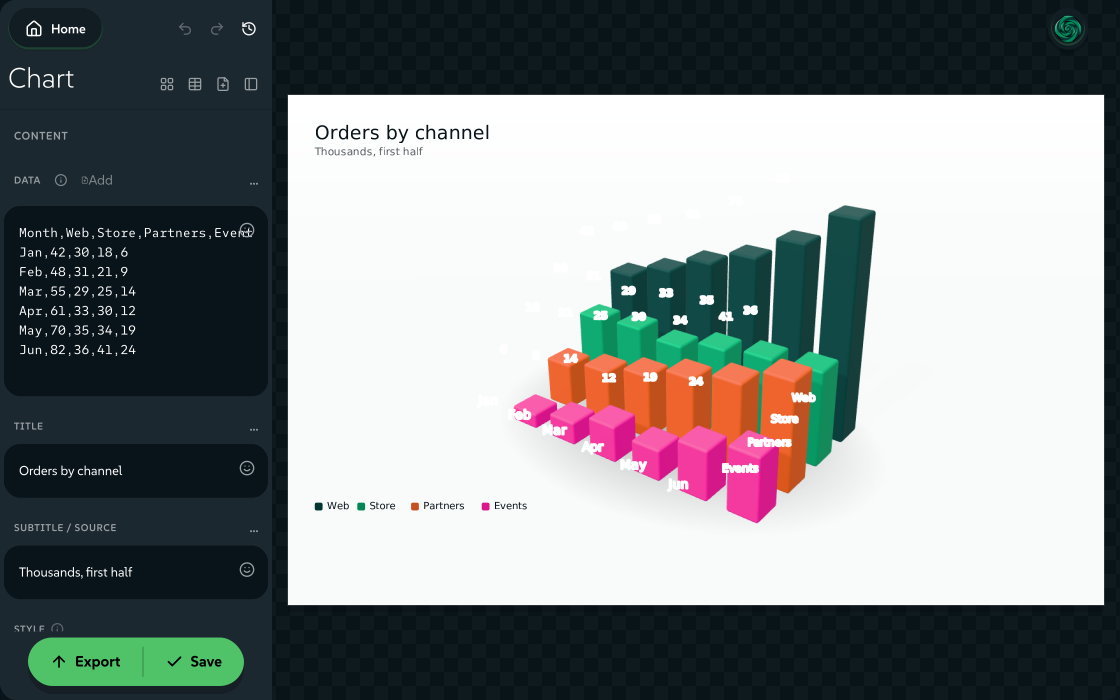
- Copy cells from Excel, Google Sheets or Numbers and paste them into Data. They arrive as a table. You can also type or paste CSV or TSV. The first row holds the column headers, the first text column becomes the labels and every numeric column becomes a series.
- Choose What to show: compare values, show change over time, show parts of a whole, understand a distribution, explain a relationship, show range or uncertainty, or tell a cinematic story. Chart reads the table, explains its assumptions, maps the columns and switches to a form that suits the goal. Choose the form myself keeps every choice manual.
- Choose a Render: Vector, Stats, 3-D or Cinema. Then press Chart type, Statistical form, 3-D chart type or Cinematic form to see every form, grouped under headings such as Compare and Change over time, and choose one. The settings for that form follow.
- When the table has more columns than the chart needs, the Data section sets which column is the category (X), which are values (Y), and for some forms which column sets depth or size. Frame / time under Animation sets the column that animates the chart.
- Add a Title and a Subtitle / source, then export.
 signed by Lollyvector SVG175 paths~10k nodes209 groups3 images390 KBCheck it yourselfAmbil file bertanda tangan
 signed by Lollyvector SVG175 paths~10k nodes209 groups3 images391 KBCheck it yourselfAmbil file bertanda tanganTry it in the app


Colour and style
Every colour comes from your design system. Palette chooses how: the design system's colours in order, colour roles first, the categorical set, a sequential or second-hue ramp, a warm or cool tint, a diverging ramp, monochrome or a ramp from one base colour. Colour by gives each series, each category or each value its own colour. By value, the colourway's ramp runs from low to high.
Style sets the character of the chart: Design system (the default), Editorial (quiet and direct), Technical (precise and dense), Poster (bold and minimal), Isometric (vector depth), Studio 3-D (design system materials) and Glass 3-D (translucent). A Transparent background leaves the chart ready to place on a slide or a photo.
The 3-D stage
The 3-D renderer builds a scene: bars by category and series, series as solid walls, a heat map raised into tiles, one block for each unit, a running-total waterfall, a city of buildings sized like a treemap, donuts and pies, rose wedges, funnels and pyramids, packed bubbles, a coiled spiral, an x, y and z scatter, and a value surface.
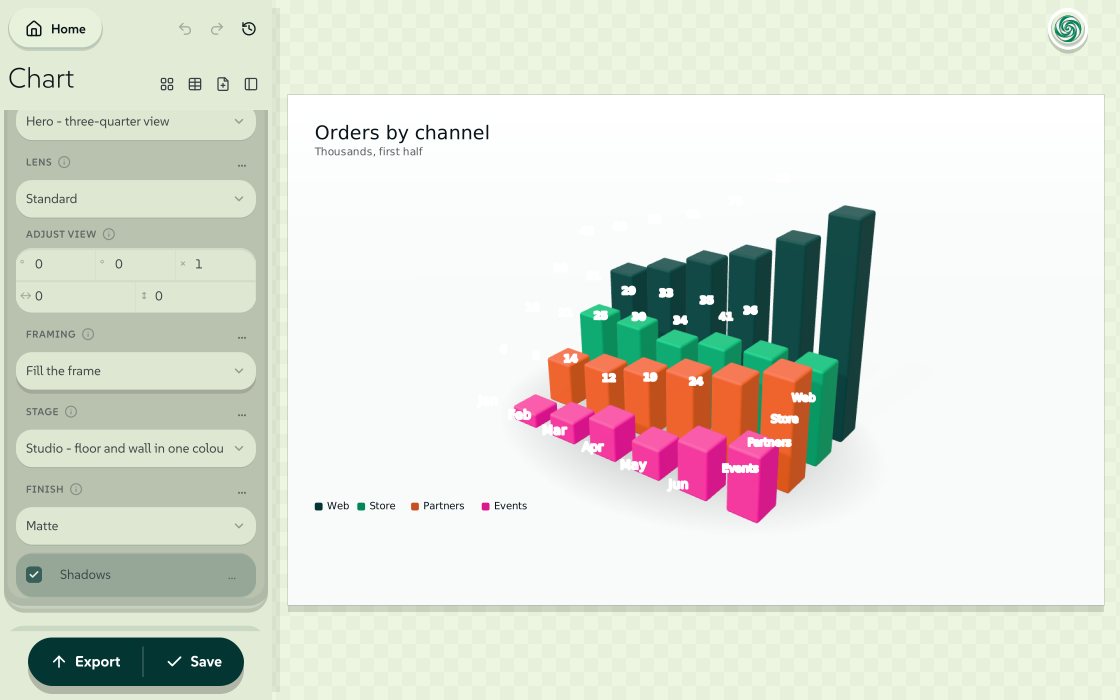
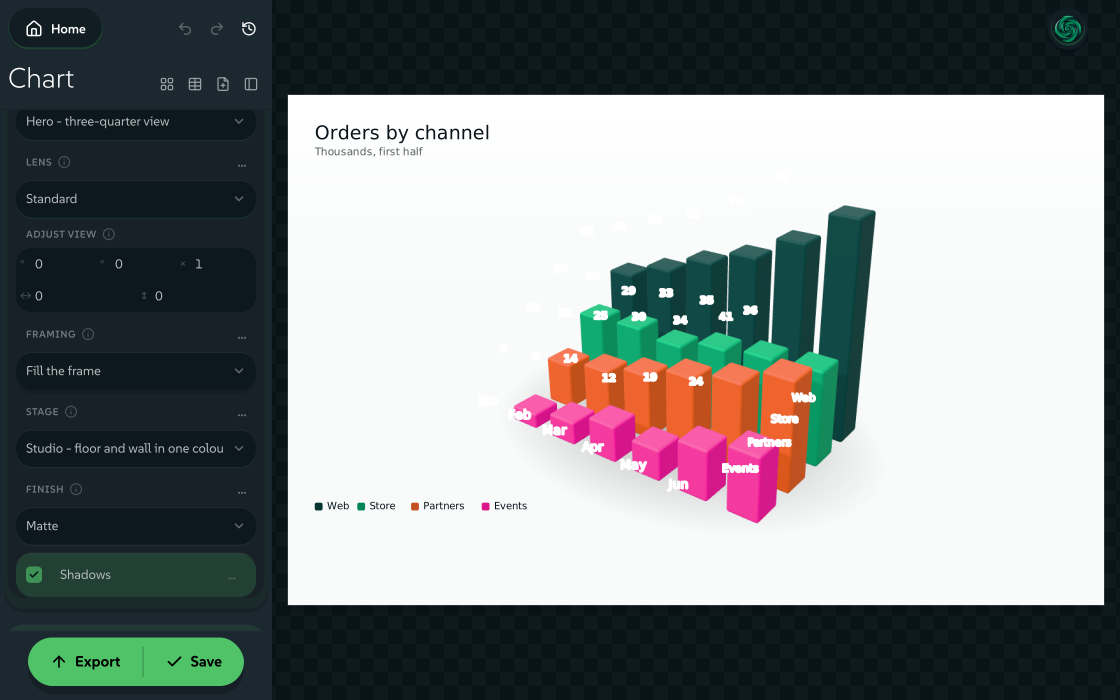
- Camera picks the view: Hero (a three-quarter view that fits the artboard), Low angle, High overview, Straight on, From the side, Top down, Isometric or a custom angle.
- On the canvas, drag to turn the chart, Shift-drag to pan and scroll to zoom. The arrow keys turn the chart while the canvas has focus. A double-click returns to the chosen camera. Adjust view keeps the result as numbers you can type, saved as an adjustment to the chosen camera. Choosing another camera starts the adjustment again from zero.
- Lens sets the perspective: standard, wide, long or flat.
- Stage sets what the chart stands on: a studio in one colour, a floor with a grid, no floor, a plinth or a night backdrop.
- Finish sets the material: flat colour with exact swatches, matte, satin, gloss, metal, clay, glass, glow, or your own roughness and metal.
- Framing fills the frame, closes in on the focus or leaves room to breathe.
- Scene motion adds a loop for video: reveal the data, rise one by one, orbit the camera, sweep across and back, or reveal and orbit.
 signed by Lollyvector SVG216 paths~9.0k nodes233 groups9 images390 KBCheck it yourselfAmbil file bertanda tangan
 signed by Lollyvector SVG216 paths~9.0k nodes233 groups9 images390 KBCheck it yourselfAmbil file bertanda tanganTry it in the app


Cinematic flights
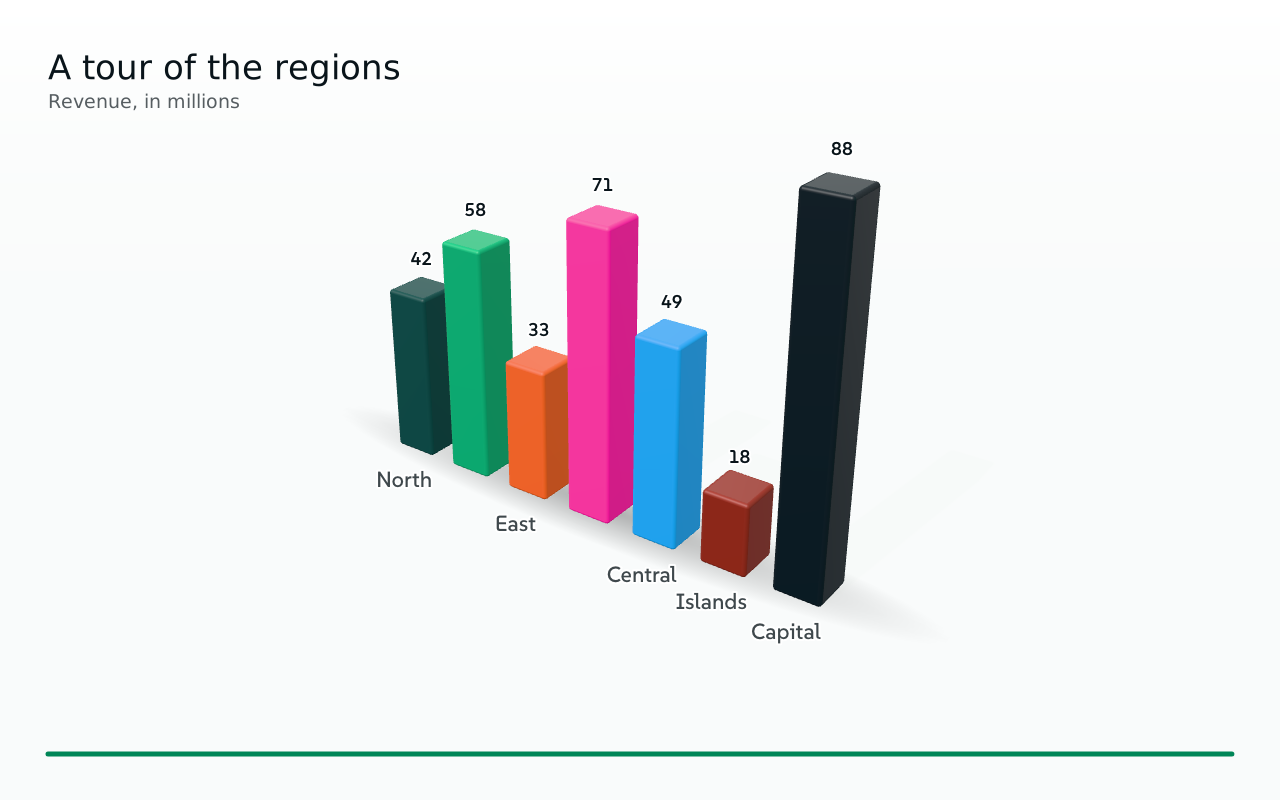
Cinema moves a camera through the data to make a short film:
- Spotlight tour stops on the values that stand out.
- Countdown ranks down to number one.
- Pull-back reveal opens on one value, then shows them all.
- Gate tunnel flies through the values.
- Terrain flight passes over peaks and low ground.
- Data flight follows the values.
- Ribbon canyon compares series as walls of a canyon.
- Constellation tours the observations.
- Data skyline flies past the values.
 signed by Lollyvector SVGpixels, not shapes158 KBCheck it yourselfAmbil file bertanda tanganTry it in the app

Export a flight as MP4, WebM, GIF, animated WebP or APNG. A still export takes the finished pose, so a PNG or a slide shows the whole chart, never the empty first frame.
Statistical forms
Stats draws an editorial dot plot, intervals and range bands, the difference between two series, indexed change from a base of 100, a box with its observations, a histogram with a rug, small multiples, distribution facets and density ridges, a cumulative distribution, a control band, hexbin density, density contours, a scatter with its regression line and a candlestick chart for open, high, low and close.
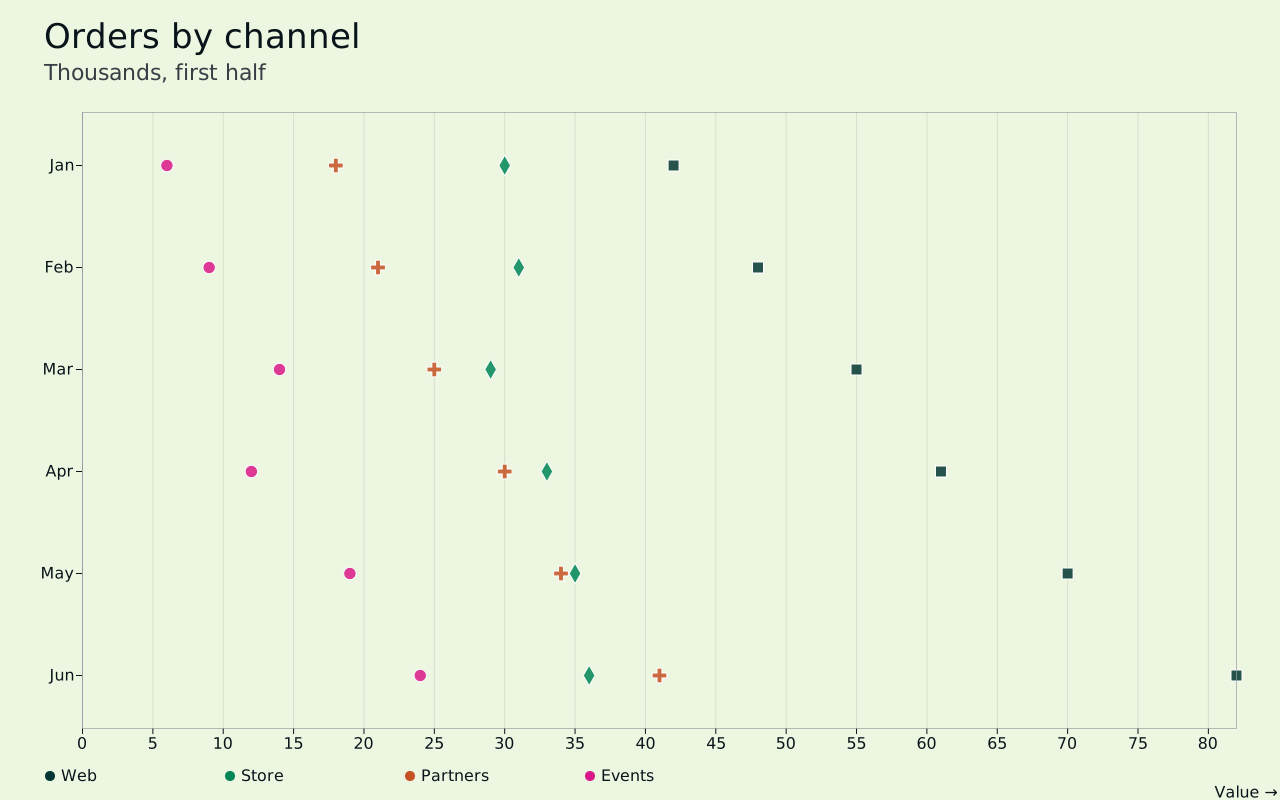 signed by Lollyvector SVG47 paths184 nodes13 groups19 KBCheck it yourselfAmbil file bertanda tanganTry it in the appEditorial dot plot. Every channel in every month on one line.
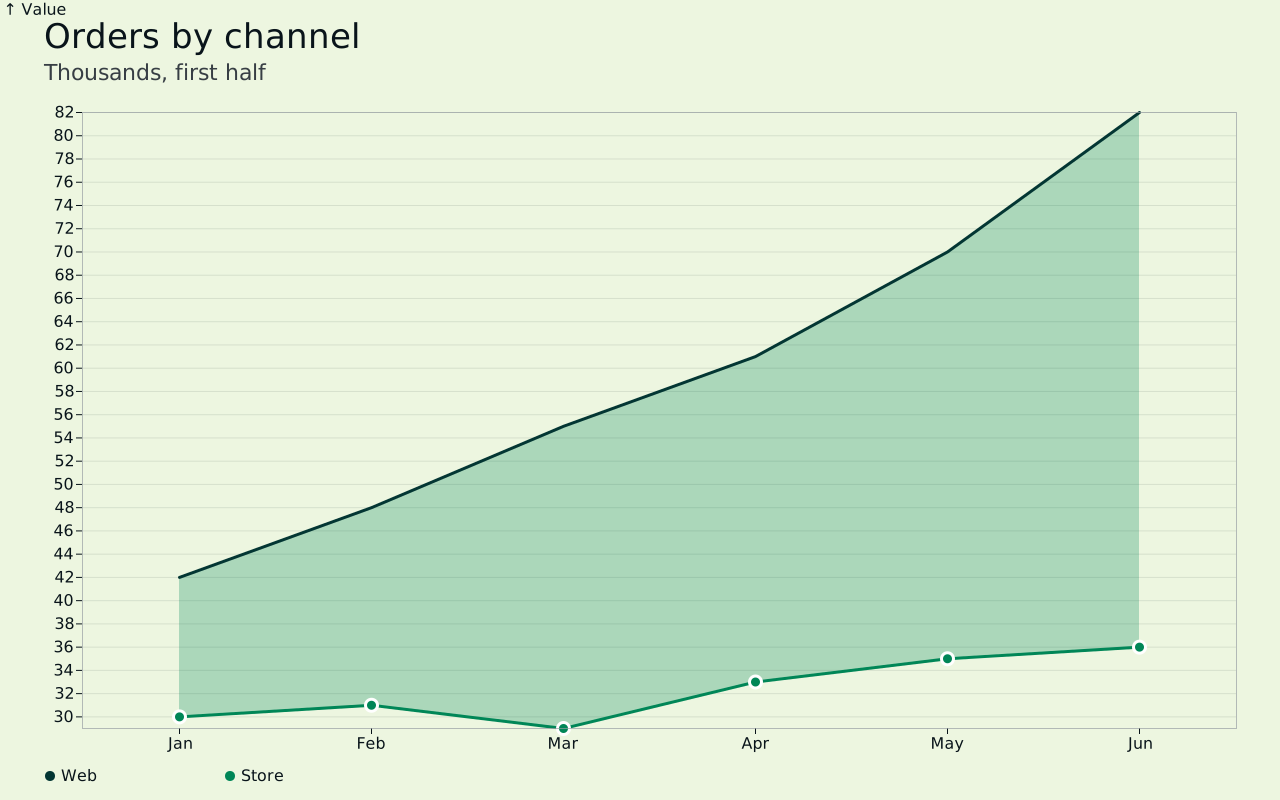 signed by Lollyvector SVG41 paths100 nodes14 groups18 KBCheck it yourselfAmbil file bertanda tanganTry it in the appDifference between series. The gap between web and store, filled.


Charts people can read
Every chart carries a written description and a table of its values. The description is part of the chart. A screen reader reads out the title and how many rows and series the chart holds, and the table gives the numbers. Colour by and Palette let you choose design system colours that are easy to tell apart.
Export and share
Chart exports to PNG, SVG, PDF, a print-ready CMYK PDF or TIFF, PowerPoint, Penpot, EMF, WebP, JPG and AVIF, and as motion to MP4, WebM, GIF, animated WebP and APNG. CSV, JSON and Markdown export the data. Vector exports keep the text as outlines, so the fonts travel with the file. Exporting covers sizes, print and video settings.
Every setting fits in a link. This link opens two months of web and store orders as 3-D bars (open the example):
/#/tool/chart?rm=scene&sct=bar3d&t=Orders%20by%20channel&d=Month,Web,Store%0AJan,42,30%0AFeb,48,31rm picks the renderer (vector, statistical, scene or cinematic), ct, pf, sct and cft pick the form, t is the title and d the table. URL Mode lists every key, and the same keys work as --name=value flags on the command line.
Next
- Lolly Design: place a chart in a layout, a deck or a timeline.
- Exporting: sizes, print files and video.
- Lolly 3D Studio: for logos, models and words in 3-D, not data.
- Templates: save a styled chart and start from it next time.